UNITED
STATES
SECURITIES
AND EXCHANGE COMMISSION
Washington,
D.C. 20549
FORM
10-K
|
(Mark
One)
|
|
|
ý
|
ANNUAL
REPORT PURSUANT TO SECTION 13 OR 15(d) OF THE SECURITIES
EXCHANGE ACT OF 1934
|
|
For
the fiscal year ended December 31, 2007
|
|
|
OR
|
|
|
o
|
TRANSITION
REPORT PURSUANT TO SECTION 13 OR 15(d) OF THE SECURITIES
EXCHANGE ACT OF 1934
|
|
For
the transition period from
____________to_________________
|
|
Commission
file Number: 0-24249
|
PDI,
Inc.
|
|||
|
(Exact
name of registrant as specified in its charter)
|
|||
|
Delaware
|
22-2919486
|
||
|
(State
or other jurisdiction of
incorporation
or organization)
|
(I.R.S.
Employer
Identification
No.)
|
||
|
Saddle
River Executive Centre
1
Route 17 South, Saddle River, NJ 07458
|
|||
|
(Address
of principal executive offices and zip code)
|
|||
|
(201)
258-8450
|
|||
|
(Registrant's
telephone number, including area code)
|
|||
|
Securities
registered pursuant to Section 12(b) of the Act:
|
|||
|
Common Stock, par value $0.01 per
share
|
The Nasdaq Stock Market
LLC
|
||
|
(Title
of each class)
|
(Name
of each exchange on which registered)
|
||
|
Securities
registered pursuant to Section 12(g) of the Act:
None
|
|||
Indicate
by checkmark if the registrant is a well-known seasoned issuer, as defined in
Rule 405 of the Securities Act. Yes o No
ý
Indicate
by checkmark if the registrant is not required to file reports pursuant to
Section 13 or Section 15(d) of the Act. Yes o No ý
Indicate
by checkmark whether the registrant (1) has filed all reports required to
be filed by Section 13 or 15 (d) of the Securities Exchange Act of
1934 during the preceding 12 months (or for such shorter period that the
registrant was required to file such reports), and (2) has been subject to
such filing requirements for the past 90 days. Yes ý No o
Indicate
by checkmark if disclosure of delinquent filers pursuant to Item 405 of
Regulation S-K is not contained herein, and will not be contained, to the
best of registrant's knowledge, in definitive proxy or information statements
incorporated by reference in Part III of this Form 10-K or any
amendment to this Form 10-K. ý
Indicate
by check mark whether the registrant is a large accelerated filer, an
accelerated filer, a non-accelerated filer, or a smaller reporting
company. See definitions of “large accelerated filer,”
“accelerated filer,” and “smaller reporting company” in rule 12b-2 of the
Exchange Act. (check one):
|
Large
accelerated filer o
|
Accelerated
filer ý
|
Non-accelerated
filer o
|
Smaller
reporting company o
|
|
(Do
not check if a smaller reporting company)
|
Indicate
by check mark whether the registrant is a shell company (as defined in
Rule 12b-2 of the Act). Yes o No ý
The
aggregate market value of the registrant's common stock, $0.01 par value per
share, held by non-affiliates of the registrant on June 29, 2007, the last
business day of the registrant's most recently completed second fiscal quarter,
was $73,621,933 (based on the closing sales price of the registrant's common
stock on that date). Shares of the registrant's common stock held by each
officer and director and each person who owns 10% or more of the outstanding
common stock of the registrant have been excluded in that such persons may be
deemed to be affiliates. This determination of affiliate status is not
necessarily a conclusive determination for other purposes. As of February 29,
2008, 14,292,220 shares of the registrant's common stock, $0.01 par value per
share, were issued and outstanding.
DOCUMENTS
INCORPORATED BY REFERENCE
Portions
of the Proxy Statement for the 2008 Annual Meeting of Stockholders (the Proxy
Statement), to be filed within 120 days of the end of the fiscal year ended
December 31, 2007, are incorporated by reference in Part III hereof. Except
with respect to information specifically incorporated by reference in this
Annual Report on Form 10-K (the Form 10-K), the Proxy Statement is not
deemed to be filed as part hereof.
PDI,
Inc.
Annual
Report on Form 10-K
|
Page
|
|||
|
PART
I
|
|||
|
Item
1.
|
Business
|
5
|
|
|
Item
1A.
|
Risk
Factors
|
9
|
|
|
Item
1B.
|
Unresolved
Staff Comments
|
15
|
|
|
Item
2.
|
Properties
|
15
|
|
|
Item
3.
|
Legal
Proceedings
|
16
|
|
|
Item
4.
|
Submission
of Matters to a Vote of Security Holders
|
16
|
|
|
PART
II
|
|||
|
Item
5.
|
Market
for our Common Equity, Related Stockholder Matters
and
Issuer Purchases of Equity Securities
|
17
|
|
|
Item
6.
|
Selected
Financial Data
|
19
|
|
|
Item
7.
|
Management’s
Discussion and Analysis of Financial Condition and Results of
Operations
|
20
|
|
|
Item
7A.
|
Quantitative
and Qualitative Disclosures about Market Risk
|
36
|
|
|
Item
8.
|
Financial
Statements and Supplementary Data
|
37
|
|
|
Item
9.
|
Changes
in and Disagreements with Accountants on Accounting and Financial
Disclosures
|
37
|
|
|
Item
9A.
|
Controls
and Procedures
|
37
|
|
|
Item
9B.
|
Other
Information
|
39
|
|
|
PART
III
|
|||
|
Item
10.
|
Directors,
Executive Officers and Corporate Governance
|
39
|
|
|
Item
11.
|
Executive
Compensation
|
39
|
|
|
Item
12.
|
Security
Ownership of Certain Beneficial Owners and Management and Related
Stockholder Matters
|
39
|
|
|
Item
13.
|
Certain
Relationships and Related Transactions, and Director
Independence
|
39
|
|
|
Item
14.
|
Principal
Accounting Fees and Services
|
39
|
|
|
PART
IV
|
|||
|
Item
15.
|
Exhibits,
Financial Statement Schedules
|
40
|
|
|
Signatures
|
42
|
||
3
PDI,
Inc.
Annual
Report on Form 10-K
|
|
FORWARD
LOOKING STATEMENT INFORMATION
|
This Form
10-K contains “forward-looking statements” within the meaning of Section 27A of
the Securities Act of 1933, as amended (the Securities Act) and Section 21E of
the Securities Exchange Act of 1934 (the Exchange Act). Statements
that are not historical facts, including statements about our plans, objectives,
beliefs and expectations, are forward-looking
statements. Forward-looking statements include statements preceded
by, followed by or that include the words “believes,” “expects,” “anticipates,”
“plans,” “estimates,” “intends,” “projects,” “should,” “may,” “will” or similar
words and expressions. These forward-looking statements are contained
throughout this Form 10-K, including, but not limited to, statements found in
Part I – Item 1 – “Business,” Part II – Item 5 – “Market for our Common Equity,
Related Stockholder Matters and Issuer Purchases of Securities,” Part II – Item
7 – “Management’s Discussion and Analysis of Financial Condition and Results of
Operation” and “Part II – Item 7A – “Quantitative and Qualitative Disclosures
About Market Risk”.
Forward-looking
statements are only predictions and are not guarantees of future
performance. These statements are based on current expectations and
assumptions involving judgments about, among other things, future economic,
competitive and market conditions and future business decisions, all of which
are difficult or impossible to predict accurately and many of which are beyond
our control. These statements also involve known and unknown risks,
uncertainties and other factors that may cause our actual results to be
materially different from those expressed or implied by any forward-looking
statement. Many of these factors are beyond our ability to control or
predict. Such factors include, but are not limited to, the
following:
|
·
|
Changes
in outsourcing trends or a reduction in promotional, marketing and sales
expenditures in the
|
|
|
pharmaceutical,
biotechnology and life sciences
industries;
|
|
·
|
Loss
of one or more of our significant customers or a material reduction in
service revenues from such
customers;
|
|
·
|
Our
ability to fund and successfully implement our long-term strategic
plan;
|
|
·
|
Our
ability to successfully develop product commercialization
opportunities;
|
|
·
|
Our
ability to successfully identify, complete and integrate any future
acquisitions and the effects of any
|
|
|
such
acquisitions on our ongoing
business;
|
|
·
|
Our
ability to meet performance goals in incentive-based and revenue sharing
arrangements with
|
|
|
customers;
|
|
·
|
Competition
in our industry;
|
|
·
|
Our
ability to attract and retain qualified sales representatives and other
key employees and management
personnel;
|
|
·
|
Product
liability claims against us;
|
|
·
|
Changes
in laws and healthcare regulations applicable to our industry or our, or
our customers’, failure to
|
|
|
comply
with such laws and regulations;
|
|
·
|
Volatility
of our stock price and fluctuations in our quarterly revenues and
earnings;
|
|
·
|
Potential
liabilities associated with insurance claims;
and
|
|
·
|
Failure
of, or significant interruption to, the operation of our information
technology and communications
|
|
|
systems.
|
Please
see Part I – Item 1A – “Risk Factors” of this Form 10-K, as well as other
documents we file with the United States Securities and Exchange Commission
(SEC) from time to time, for other important factors that could cause our
actual results to differ materially from our current expectations and from the
forward-looking statements discussed in this Form 10-K. Because of
these and other risks, uncertainties and assumptions, you should not place undue
reliance on these forward-looking statements. In addition, these statements
speak only as of the date of the report in which they are set forth and, except
as may be required by law, we undertake no obligation to revise or update
publicly any forward-looking statements for any reason.
4
PDI,
Inc.
Annual
Report on Form 10-K (continued)
PART
I
|
ITEM
1.
|
BUSINESS
|
|
Summary
of Business
|
We are a
leading provider of contract sales teams to pharmaceutical companies, offering a
range of sales support services designed to achieve their strategic and
financial product objectives. In addition to contract sales teams, we also
provide marketing research, physician interaction and medical education
programs. Our services offer customers a range of promotional and
educational options
for the commercialization of their products throughout their lifecycles, from
development through maturity. We provide innovative and flexible service
offerings designed to drive our customers’ businesses forward and successfully
respond to a continually changing market. Our services provide a
vital link between our customers and the medical community through the
communication of product information to physicians and other healthcare
professionals for use in the care of their patients.
We
are among the leaders in outsourced pharmaceutical sales and marketing services
in the United States. We have evolved our commercial capabilities through
innovation, organic growth and acquisitions. We have designed and
implemented programs for many large pharmaceutical companies as well as a
variety of emerging and specialty pharmaceutical companies. We
recognize that our relationships with customers are dependent upon the quality
of our performance, and our focus is to flawlessly execute our customers’
programs in order to consistently deliver their desired results.
Typically,
our customers engage us on a contractual basis to design and implement
promotional and educational programs for both prescription and over-the-counter
products. The programs are tailored to meet the specific needs of the
product and the customer. These services are provided predominantly on a
fee-for-service basis. These contracts can include incentive payments that
can be earned if our activities generate results that meet or exceed performance
targets. Contracts may be terminated with or without cause by our
customers. Certain contracts provide that we may incur specific penalties
if we fail to meet stated performance benchmarks.
We
commenced operations as a contract sales organization (CSO) in 1987 and we
completed our initial public offering in May 1998. Our executive offices
are located at Saddle River Executive Centre, 1 Route 17 South, Saddle River,
New Jersey 07458 and our telephone number is (800) 242-7494.
Strategy
In 2007
we initiated the implementation of a five-year strategic plan that is intended
to drive revenue growth, diversify the sources of our revenue, increase profit
margins, and further enhance our competitiveness in the markets we
serve. We further refined this strategic plan in the first quarter of
2008. The primary components of this strategic plan include the
following:
|
|
·
|
Recapture
our position as the leading contract sales
organization. We endeavor to restore our position as the
number one contract sales organization in the U.S. In order to
achieve this goal, we have strengthened our business development strategy,
process and implementation through the expansion of these capabilities and
the development of relationships with alternate business development
channels, including a focus on opportunities in the emerging
pharmaceutical market. Furthermore, we are actively building a
corporate culture that fosters continuous innovation with the purpose of
creating new and differentiated offerings that enable emerging and
established pharmaceutical companies to address their evolving business
needs. One such example is our “PDI ON DEMAND” suite of sales support
services, which we introduced during
2007.
|
|
|
·
|
Enhance our
commercialization capabilities in order to provide a broader base of
services and more diversified sources of revenue. We
believe that it is critical to the growth of our business to identify and
build internally and/or acquire complementary commercialization services
that add-value and even greater depth to the already robust suite of
services we presently offer. We intend to focus our efforts
adding services that strengthen our core business, expand the scope of our
current service offerings and/or provide our customers alternative methods
for physician and healthcare professional engagement. We
believe that these complementary services will provide us with additional
avenues for revenue growth and increased profit margins while
simultaneously increasing our ability to meet the particular demands of
emerging pharmaceutical companies that typically seek a broad range of
outsourced commercialization services from a single
supplier.
|
5
PDI,
Inc.
Annual
Report on Form 10-K (continued)
|
|
·
|
Leverage
our sales and marketing expertise to capitalize on product
commercialization opportunities. We intend to identify
and take advantage of attractive opportunities to enter into arrangements
with pharmaceutical companies to provide sales and marketing support
services and potentially limited capital in connection with the promotion
of pharmaceutical products in exchange for a percentage of product
sales. These types of arrangements will likely involve a
significant upfront investment of our resources with no guaranteed return
on investment and are expected to generate losses in the first year of the
contract as program ramp up occurs. However, these
opportunities are intended to provide us with the ability to extend our
revenue streams through multi-year arrangements and with profit margins
that are significantly higher than typical fee for service arrangements
over the term of the contract.
|
|
Reporting
Segments and Operating Groups
|
For 2007,
we reported under the following three segments: Sales Services, Marketing
Services and PDI Products Group (PPG). For details on revenue,
operating results and total assets by segment, see Note 18 to the consolidated
financial statements.
Sales
Services
This
segment, which focuses primarily on product detailing, includes our Performance
Sales Teams and Select Accessä Teams (formerly referred
to as Shared Teams). This segment, which focuses on product
detailing, represented 74.1% of our consolidated revenue for the year ended
December 31, 2007.
Product
detailing involves a sales representative meeting face-to-face with targeted
physicians and other healthcare decision makers to provide a technical review of
the product being promoted. Contract sales teams can be deployed on
either a dedicated or shared basis.
This
segment also includes a portfolio of expanded sales services known as “PDI ON
DEMAND”, which includes talent acquisition services, pulsing teams and vacancy
coverage services. Our talent acquisition platform provides
pharmaceutical customers with an outsourced, stand-alone sales force recruiting
and on-boarding service. Pulsing teams provide temporary full or
flex-time sales teams of any size anywhere in the United States which are
designed to help our customers increase brand impact during key market cycles or
rapidly respond to regional opportunities. Our vacancy coverage
service provides customers with outsourced temporary full or flex-time sales
representatives to fill temporary territory vacancies created by leaves of
absence within our customers’ internal sales forces, which allows our customers
to maintain continuity of services.
Performance Sales
Teams
A
performance contract sales team works exclusively on behalf of one
customer. The sales team is customized to meet the customer’s
specifications with respect to sales representative profile, physician
targeting, product training, incentive compensation plans, integration with the
customers’ in-house sales forces, call reporting platform and data
integration. Without adding permanent personnel, our customer gets a
high quality, industry-standard sales team comparable to its internal sales
force.
Select
Access
Select
Access represents a shared sales team business model where multiple
non-competing brands are represented for different pharmaceutical
companies. Using these teams, we make a face-to-face selling resource
available to those customers who want an alternative to a dedicated
team. We are a leading provider of this type of detailing program in
the United States. Since costs are shared among various companies,
these programs may be less expensive for the customer than programs involving a
dedicated sales force. With a shared sales team, our customers
receive targeted coverage of its physician audience within the representatives’
geographic territories.
Marketing
Services
This
segment, which includes our Pharmakon, TVG Marketing Research & Consulting
and Vital Issues in Medicine business units, represented 25.9% of consolidated
revenue for the year ended December 31, 2007.
Pharmakon
Pharmakon’s
emphasis is on the creation, design and implementation of promotional physician
interaction programs. Each marketing program can be offered through a
number of different media and venues, including teleconferences, dinner
meetings, “lunch and learns” and webcasts. Within each of our
programs, we offer a number of services including strategic design, tactical
execution, technology support, audience recruitment, moderator
6
PDI,
Inc.
Annual
Report on Form 10-K (continued)
services
and thought leader management. In the last ten years, Pharmakon has
conducted over 45,000 physician interaction programs with more than 550,000
participants. Pharmakon’s peer programs can be designed as
promotional or marketing research/advisory programs. In addition to
physician interaction programs, Pharmakon also provides promotional
communications activities. We acquired Pharmakon in August
2004.
TVG Marketing Research &
Consulting
TVG
Marketing Research & Consulting (TVG) employs leading edge, and in some
instances proprietary, research methodologies to provide qualitative and
quantitative marketing research to pharmaceutical companies with respect to
healthcare providers, patients and managed care customers in the United States
and globally. We offer a full range of pharmaceutical marketing
research services, including studies designed to identify the highest impact
business strategy, profile, positioning, message, execution, implementation and
post implementation for a product. We believe our marketing research
model improves our customers’ knowledge about how physicians and other
healthcare professionals will likely react to products.
We
utilize a systematic approach to pharmaceutical marketing
research. Recognizing that every marketing need, and therefore every
marketing research solution, is unique, we have developed our marketing model to
help identify the work that needs to be done in order to identify critical paths
to marketing goals. At each step of the marketing model, we can offer
proven research techniques, proprietary methodologies and customized study
designs to address specific product needs.
Vital Issues in
Medicine
Our Vital
Issues in Medicine (VIM®) business unit develops and executes continuing
medical education services funded by the biopharmaceutical and medical device
and diagnostics industries. Using an expert-driven, customized approach,
we provide faculty development/advocacy, continuing medical education activities
in a wide variety of formats, and interactive initiatives to generate additional
value to our customers' portfolios.
PDI
Products Group (PPG)
In the
past, the goal of the PPG segment was to source biopharmaceutical products in
the United States through licensing, co-promotion, acquisition or integrated
commercialization services arrangements. This segment did not have any revenue
for the years ended December 31, 2007 and 2006. We are no longer
pursuing licensing or acquisition of pharmaceutical products.
However,
we currently contemplate that any product commercialization arrangements
described above under “—Strategy” that we may engage in will be included within
this segment.
|
Contracts
|
Our
contracts are nearly all fee for service. They may contain
operational benchmarks, such as a minimum amount of activity within a specified
amount of time. These contracts can include incentive payments that
can be earned if our activities generate results that meet or exceed agreed
performance targets. Contracts may generally be terminated with or
without cause by our clients. Certain contracts provide that we may
incur specific penalties if we fail to meet stated performance
benchmarks.
Sales
Services
Historically,
the majority of our revenue has been generated by contracts for dedicated sales
teams. These contracts are generally for terms of one to two years
and may be renewed or extended. The majority of these contracts,
however, are terminable by the client for any reason upon 30 to 90 days’
notice. Certain contracts provide for termination payments if the
client terminates the contract without cause. Typically, however,
these penalties do not offset the revenue we could have earned under the
contract or the costs we may incur as a result of its
termination. The loss or termination of a large contract or the loss
of multiple contracts could have a material adverse effect on our business,
financial condition, or results of operations or cash
flow.
Marketing
Services
Our
marketing services contracts generally take the form of either master service
agreements with a term of one to three years, or contracts specifically related
to particular projects with terms for the duration of the project, typically
lasting from two to six months. These contracts are generally
terminable by the customer for any reason. Upon termination, the
customer is generally responsible for payment for all work completed to date,
plus the cost of any nonrefundable commitments made on behalf of the
customer. There is significant customer concentration in our
Pharmakon business, and the loss or termination of one or more of Pharmakon’s
large master service agreements could have a material adverse effect on our
business, financial condition or results of operations. Due to the
typical
7
PDI,
Inc.
Annual
Report on Form 10-K (continued)
size of
most of TVG’s and VIM’s contracts, it is unlikely the loss or termination of any
individual TVG or VIM contract would have a material adverse effect on our
business, financial condition, results of operations, or cash flow.
|
Significant
Customers
|
Our three
largest customers as of December 31, 2007 accounted for 13.7%, 12.9% and 11.3%,
respectively, or approximately 37.9% in the aggregate, of our revenue for the
year ended December 31, 2007. On March 21, 2007, we announced that a large
pharmaceutical company customer had notified us of its intention not to renew
its contract sales engagement with us upon its scheduled expiration on May 12,
2007. This contract accounted for 12.8% of our revenue in
2007.
|
Marketing
|
Our
marketing efforts target established and emerging companies in the
biopharmaceutical and life sciences industries. Our marketing efforts
are designed to reach the senior sales, marketing, and business development
personnel within these companies, with the goal of informing them of the
services we offer and the value we can bring to their products. Our
tactical plan usually includes advertising in trade publications, direct mail
campaigns, presence at industry seminars and conferences and a direct selling
effort. We have a dedicated team of business development specialists
who work within our business units to identify needs and opportunities within
the biopharmaceutical and life sciences industries that we can address. We
review possible business opportunities as identified by our business development
team and develop a customized strategy and solution for each attractive business
opportunity.
Competition
With
respect to our sales services segment, we compete with our customers’ ability to
manage their needs internally. In addition, a small number of
providers comprise the market for outsourced pharmaceutical sales teams, and we
believe that PDI, inVentiv Health Inc., Innovex Inc. and Publicis Groupe SA
combined accounted for the majority of the U.S. outsourced sales team market
share in 2007. Our marketing services segment operates in a highly
fragmented and competitive market.
There are
relatively few barriers to entry into the businesses in which we operate and, as
the industry continues to evolve, new competitors are likely to emerge. We
compete on the basis of such factors as reputation, service quality, management
experience, performance record, customer satisfaction, ability to respond to
specific customer needs, integration skills and price. Increased
competition and/or a decrease in demand for our services may also lead to other
forms of competition. While we believe we compete effectively with
respect to each of these factors, most of our current and potential competitors
are larger than we are and have substantially greater capital, personnel and
other resources than we have. Increased competition may lead to
pricing pressures and competitive practices that could have a material adverse
effect on our market share, our ability to source new business opportunities as
well as our business, financial condition and results of
operations.
|
Employees
|
As of
February 29, 2008, we had approximately 1,100 employees, including approximately
550 full-time employees. Approximately 85% of our employees are field
sales representatives and sales managers. We are not party to a
collective bargaining agreement with any labor union. We believe our
relationship with our employees is generally positive.
|
Available
Information
|
Our
website address is www.pdi-inc.com. We
are not including the information contained on our website as part of, or
incorporating it by reference into, this Form 10-K. We make available
free of charge through our website our annual reports on Form 10-K, quarterly
reports on Form 10-Q, current reports on Form 8-K, and all amendments to those
reports as soon as reasonably practicable after such material is electronically
filed with or furnished to the SEC.
The
public may read and copy any materials we file with the SEC at the SEC's Public
Reference Room at 100 F Street, N.E., Washington, D.C. 20549. The public may
obtain information on the operation of the Public Reference Room by calling the
SEC at 1-800-SEC-0330. The SEC maintains an Internet site that
contains reports, proxy and information statements, and other information
regarding registrants such as us that file electronically with the SEC. The
website address is www.sec.gov.
8
PDI,
Inc.
Annual
Report on Form 10-K (continued)
Government
and Industry Regulation
The
healthcare sector is heavily regulated by both government and industry. Various
laws, regulations and guidelines established by government, industry and
professional bodies affect, among other matters, the approval, provision,
licensing, labeling, marketing, promotion, price, sale and reimbursement of
healthcare services and products, including pharmaceutical
products. The federal government has extensive enforcement powers
over the activities of pharmaceutical manufacturers, including authority to
withdraw product approvals, commence actions to seize and prohibit the sale of
unapproved or non-complying products, to halt manufacturing operations that are
not in compliance with good manufacturing practices, and to impose or seek
injunctions, voluntary recalls, and civil, monetary, and criminal
penalties.
The Food,
Drug and Cosmetic Act, as supplemented by various other statutes, regulates,
among other matters, the approval, labeling, advertising, promotion, sale and
distribution of drugs, including the practice of providing product samples to
physicians. Under this statute, the Food and Drug Administration (FDA) regulates
all promotional activities involving prescription drugs. The
distribution of pharmaceutical products is also governed by the Prescription
Drug Marketing Act (PDMA), which regulates promotional activities at both the
federal and state level. The PDMA imposes extensive licensing,
personnel record keeping, packaging, quantity, labeling, product handling and
facility storage and security requirements intended to prevent the sale of
pharmaceutical product samples or other diversions. Under the PDMA
and its implementing regulations, states are permitted to require registration
of manufacturers and distributors who provide pharmaceutical products even if
such manufacturers or distributors have no place of business within the
state. States are also permitted to adopt regulations limiting the
distribution of product samples to licensed practitioners and require extensive
record keeping and labeling of such samples for tracing purposes. The
sale or distribution of pharmaceutical products is also governed by the Federal
Trade Commission Act.
Some of
the services that we currently perform or that we may provide in the future may
also be affected by various guidelines established by industry and professional
organizations. For example, ethical guidelines established by the American
Medical Association (AMA) govern, among other matters, the receipt by physicians
of gifts from health-related entities. These guidelines govern honoraria and
other items of economic value that AMA member physicians may receive, directly
or indirectly, from pharmaceutical companies. Similar guidelines and policies
have been adopted by other professional and industry organizations, such as
Pharmaceutical Research and Manufacturers of America, an industry trade
group. In addition, the Office of the Inspector General has also issued
guidance for pharmaceutical manufacturers and the Accreditation Council for
Continuing Medical Education has issued guidelines for providers of continuing
medical education.
There are
also numerous federal and state laws pertaining to healthcare fraud and abuse as
well as increased scrutiny regarding the off-label promotion and marketing of
pharmaceutical products and devices. In particular, certain federal and state
laws prohibit manufacturers, suppliers and providers from offering, giving or
receiving kickbacks or other remuneration in connection with ordering or
recommending the purchase or rental of healthcare items and services. The
federal anti-kickback statute imposes both civil and criminal penalties for,
among other things, offering or paying any remuneration to induce someone to
refer patients to, or to purchase, lease or order (or arrange for or recommend
the purchase, lease or order of) any item or service for which payment may be
made by Medicare or other federally-funded state healthcare programs (e.g., Medicaid). This statute
also prohibits soliciting or receiving any remuneration in exchange for engaging
in any of these activities. The prohibition applies whether the remuneration is
provided directly or indirectly, overtly or covertly, in cash or in kind.
Violations of the statute can result in numerous sanctions, including criminal
fines, imprisonment and exclusion from participation in the Medicare and
Medicaid programs. Several states also have referral, fee splitting
and other similar laws that may restrict the payment or receipt of remuneration
in connection with the purchase or rental of medical equipment and supplies.
State laws vary in scope and have been infrequently interpreted by courts and
regulatory agencies, but may apply to all healthcare items or services,
regardless of whether Medicare or Medicaid funds are involved.
|
ITEM
1A.
|
RISK
FACTORS
|
In
addition to the other information provided in this Form 10-K, you should
carefully consider the following factors in evaluating our business, operations
and financial condition. Additional risks and uncertainties not
presently known to us, which we currently deem immaterial or that are similar to
those faced by other companies in our industry or businesses in general, such as
competitive conditions, may also impair our business operations. The
occurrence of any of the following risks could have a material adverse effect on
our business, financial condition or results of operations.
Changes
in outsourcing trends in the pharmaceutical and biotechnology industries could
materially and
9
PDI,
Inc.
Annual
Report on Form 10-K (continued)
adversely
affect our business, financial condition and results of operations.
Our
business depends in large part on demand from the pharmaceutical and life
sciences industries for outsourced marketing and sales services. The
practice of many companies in these industries has been to hire outside
organizations like us to conduct large sales and marketing projects on their
behalf. However, companies may elect to perform these services
internally for a variety of reasons, including the rate of new product
development and FDA approval of those products, the number of sales
representatives employed internally in relation to demand for or the need to
promote new and existing products, and competition from other
suppliers. Recently, there has been a slow-down in the rate of
approval of new products by the FDA and this trend may continue. Additionally,
several large pharmaceutical companies have recently made changes to their
commercial model by reducing the number of sales representatives employed
internally and through outside organizations like us. If the
pharmaceutical and life sciences industries reduce their tendency to outsource
these projects, our business, financial condition and results of operations
could be materially and adversely affected.
If
companies in the life sciences industries significantly reduce their
promotional, marketing and sales expenditures or significantly reduce or
eliminate the role of pharmaceutical sales representatives in the promotion of
their products, our business, financial condition and results of operations
would be materially and adversely affected.
Our
revenues depend on promotional, marketing and sales expenditures by companies in
the life sciences industries, including the pharmaceutical and biotechnology
industries. Promotional, marketing and sales expenditures by
pharmaceutical manufacturers have in the past been, and could in the future be,
negatively impacted by, among other things, governmental reform or private
market initiatives intended to reduce the cost of pharmaceutical products or by
governmental, medical association or pharmaceutical industry initiatives
designed to regulate the manner in which pharmaceutical manufacturers promote
their products. Furthermore, the trend in the life sciences industries toward
consolidation may result in a reduction in overall sales and marketing
expenditures and, potentially, a reduction in the use of contract sales and
marketing services providers. If companies in the life sciences
industries significantly reduce their promotional, marketing and sales
expenditures or significantly reduce or eliminate the role of pharmaceutical
sales representatives in the promotion of their products, our business,
financial condition and results of operations would be materially and adversely
affected.
Our
service contracts are generally short-term agreements and are cancelable at any
time, which may result in lost revenue and additional costs and
expenses.
Our
service contracts are generally for a term of one to two years (certain of our
operating entities have contracts of shorter duration) and many may be
terminated by the customer at any time for any reason. In addition,
our customers may significantly reduce the number of representatives we deploy
on their behalf. The early termination or significant reduction of a
contract by one of our customers not only results in lost revenue, but also
typically causes us to incur additional costs and expenses. All of
our sales representatives are employees rather than independent contractors.
Accordingly, when a contract is significantly reduced or terminated, unless we
can immediately transfer the related sales force to a new program, if permitted
under the contract, we must either continue to compensate those employees,
without realizing any related revenue, or terminate their employment. If we
terminate their employment, we may incur significant expenses relating to their
termination. The loss, termination or significant reduction of a
large contract or the loss of multiple contracts could have a material adverse
effect on our business, financial condition and results of
operations.
Most
of our revenue is derived from a limited number of customers, the loss of any
one of which could materially and adversely affect our business, financial
condition or results of operations.
Our
revenue and profitability depend to a great extent on our relationships with a
limited number of large pharmaceutical companies. As of December 31, 2007, our
three largest customers accounted for approximately 13.7%, 12.9% and 11.3%
respectively, or approximately 37.9% in the aggregate, of our revenue for the
year ended December 31, 2007. For the year ended December 31, 2006,
our three largest customers accounted for 28.5%, 18.3% and 9.9%, respectively,
or approximately 56.7% in the aggregate, of our revenue. For the year
ended December 31, 2005, our three largest customers, each of whom represented
10% or more of our revenue, accounted for, in the aggregate, approximately 73.6%
of our revenue. We are likely to continue to experience a high degree
of customer concentration, particularly if there is further consolidation within
the pharmaceutical industry.
The loss
or a significant reduction of business from any of our major customers could
have a material adverse effect on our business, financial condition or results
of operations. For example, during 2006 and 2007, we announced the
termination and expiration of a number of significant service contracts,
including our sales force engagements with AstraZeneca, GlaxoSmithKline (GSK),
sanofi-aventis and another large pharmaceutical company
10
PDI,
Inc.
Annual
Report on Form 10-K (continued)
customer. These
four customers accounted for approximately $150.9 million in revenue during 2006
and $15.9 million in revenue during 2007.
Our
senior management team is currently in the process of implementing our long-term
strategic plan. There can be no assurance that we will successfully implement
this plan.
In May
2006, Michael Marquard and Jeffrey Smith joined us as our chief executive
officer and chief financial officer, respectively. In 2007, we
initiated the implementation of a five-year strategic plan that was further
refined in the first quarter of 2008. In order to implement our
strategic plan, we may seek to do one or more of the following:
|
·
|
introduce
new sales support services that provide greater flexibility to our
customers;
|
|
·
|
organically
develop or acquire complementary commercialization services in order to
expand our portfolio of service offerings to the biopharmaceutical and
life sciences industries and to strengthen our contract sales offerings;
and
|
|
·
|
explore
attractive product commercialization
opportunities.
|
While we
expect to expend significant funds and other resources implementing this
strategy, there can be no assurance that we will successfully implement this
strategy or be able to expand our market share, increase revenue, yield a return
on investment and/or improve stockholder value.
If
we pursue product commercialization opportunities as part of our long-term
strategic plan, we cannot assure you that we can successfully develop this
business.
In
accordance with our strategic plan, we intend to explore opportunities to enter
into arrangements with biopharmaceutical companies to provide sales and
marketing support services and potentially limited capital in connection with
the promotion of pharmaceutical products in exchange for a percentage of product
sales. It is likely that these types of arrangements will require us
to make a significant upfront investment of our resources and are expected to
generate losses in the first year of the contract as program ramp up
occurs. In addition, we envision that these types of contracts will
have limited termination rights and the compensation we will receive is expected
to consist entirely of a percentage of sales of the product, and in certain
arrangements we may not receive any compensation unless product sales exceed an
agreed upon baseline. There can be no assurance that our forecasts
relating to product sales will prove to be accurate. In addition,
there are a number of factors that could negatively impact product sales during
the term of the contract, including withdrawal of the product from the market,
the launch of a therapeutically equivalent generic version of the product, the
introduction of a competing product, loss of managed care covered lives, a
significant disruption in the manufacture or supply of the product as well as
other significant events that could affect sales of the product or the
prescription market for the product. Therefore, the revenue we
receive, if any, from product sales under these types of arrangements may not be
sufficient to offset the costs incurred by us implementing and maintaining these
programs.
We
may make acquisitions in the future which may lead to disruptions to our ongoing
business.
Historically,
we have made a number of acquisitions, and our strategic plan contemplates
pursuing new acquisition opportunities. If we are unable to
successfully integrate an acquired company, the acquisition could lead to
disruptions to our business. The success of an acquisition will
depend upon, among other things, our ability to:
|
·
|
assimilate
the operations and services or products of the acquired
company;
|
|
·
|
integrate
new personnel associated with the
acquisition;
|
|
·
|
retain
and motivate key employees;
|
|
·
|
retain
customers; and
|
|
·
|
minimize
the diversion of management’s attention from other business
concerns.
|
In the
event that the operations of an acquired business do not meet our performance
expectations, we may have to restructure the acquired business or write-off the
value of some or all of the assets of the acquired business, including goodwill
and other intangible assets identified at time of acquisition.
In
addition, the current market for acquisition targets in our industry is
extremely competitive, and there can be no assurance that we will be able to
successfully identify, bid for and complete acquisitions necessary or desirable
to achieve our goals.
If
we do not meet performance goals established in our incentive-based arrangements
with customers, our revenue could be materially and adversely
affected.
We have
entered into a number of incentive-based arrangements with our pharmaceutical
company customers,
11
PDI,
Inc.
Annual
Report on Form 10-K (continued)
and our
strategic plan contemplates an increased focus on these types of arrangements.
Under incentive-based arrangements, we are typically paid a lower fixed fee and,
in addition, have an opportunity to earn additional compensation upon achieving
specific performance metrics with respect to the products being
detailed. Typically, these performance metrics relate to targeted
sales or prescription volumes, sales force performance metrics or a combination
thereof. These types of arrangements transfer some market risk from our
customers to us. In addition, these arrangements can result in variability in
our incentive-based earnings (and therefore our revenue) due to seasonality of
product usage, changes in market share, new product introductions (including the
introduction of competing generic products into the market), overall promotional
efforts and other market related factors. If we are unable to meet
the performance goals established in our incentive-based arrangements, our
revenue could be materially and adversely affected.
Additionally,
certain of our service contracts may contain penalty provisions pursuant to
which our fixed fees may be significantly reduced if we do not meet certain
minimum performance metrics, which may include number and timing of sales calls,
physician reach, territory vacancies and/or sales representative
turnover.
Our
industry is highly competitive and our failure to address competitive
developments promptly will limit our ability to retain and increase our market
share.
Our
primary competitors for sales and marketing services include in-house sales and
marketing departments of pharmaceutical companies, other CSOs and providers of
marketing and related services, including medical education and marketing
research providers. There are relatively few barriers to entry in the
businesses in which we compete and, as the industry continues to evolve, new
competitors are likely to emerge. Most of our current and potential competitors
are larger than we are and have substantially greater capital, personnel and
other resources than we have. Increased competition may lead to
pricing pressures and competitive practices that could have a material adverse
effect on our market share, our ability to source new business opportunities as
well as our business, financial condition and results of
operations.
Due to the expiration and termination
of several significant contracts during 2006 and 2007 and the implementation of
our new long-term strategic plan, our historical revenue and results of
operations cannot be relied upon as representative of the revenue and results of
operations that we may achieve in 2008 and future periods.
As noted
above, during 2006 and the first half of 2007, we experienced the expiration and
termination of several significant contracts, including termination of our
AstraZeneca contract sales force agreement effective as of April 30, 2006, the
termination of our contract sales force agreement with sanofi-aventis effective
as of December 1, 2006, the expiration of our contract sales force agreement
with GSK on December 31, 2006 and the expiration of our contract sales force
agreement with a large pharmaceutical company customer on May 12,
2007. These four customers accounted for an aggregate of
approximately $150.9 million of revenue during 2006 and $15.9 million of revenue
during 2007. Unless and until we generate sufficient new business to
offset the loss of these contracts, our financial results for previous periods
will not be duplicated in future periods, and future revenue and cash flows from
operations will be significantly less than in previous periods. In
addition, we expect to incur a net loss for 2008 and may incur net losses in
future periods. Our senior management is also in the process of
implementing our long-term strategic plan. This plan includes, in
part, a focus on supplementing our current service offerings with complementary
commercialization service offerings to the biopharmaceutical and life sciences
industries. To the extent this element of our strategic plan is
realized during 2008 and in future periods, these may constitute new service
offerings for which there were no comparable financial results during 2006 or
2007. We may also make significant expenditures in connection with
any acquisitions that we may pursue in connection with our strategic
plan. Additionally, if we pursue product commercialization
opportunities as contemplated by our strategic plan, these types of arrangements
will require us to incur significant costs with no guarantee that any revenue we
would receive from product sales would be sufficient to offset such
costs.
We
may require additional funds in order to implement our strategic plan and
evolving business model.
In
accordance with our strategic plan discussed above, we may require additional
funds in order to pursue other business opportunities or meet future operating
requirements, develop incremental marketing and sales capabilities; and/or
acquire other services businesses. We may seek additional funding
through public or private equity or debt financing or other arrangements with
collaborative partners. If we raise additional funds by issuing
equity securities, further dilution to existing stockholders may
result. As a condition to providing us with additional funds, future
investors may demand, and may be granted, rights superior to those of existing
stockholders. In addition, any future debt financing we may enter
into may require us to comply with specified financial ratios, including
ratios
12
PDI,
Inc.
Annual
Report on Form 10-K (continued)
regarding
interest coverage, total leverage, senior secured leverage and fixed charge
coverage. Our ability to comply with these ratios may be affected by
events beyond our control.
We cannot
be certain; however, that additional financing will be available from any of
these sources or, if available, will be available on acceptable or affordable
terms. If adequate additional funds are not available, we may be
required to delay, reduce the scope of, or eliminate one or more of our
strategic initiatives.
Product
liability claims could harm our business.
We could
face substantial product liability claims in the event any of the pharmaceutical
or other products we have previously marketed or market now or may in the future
market are alleged to cause negative reactions or adverse side effects or in the
event any of these products causes injury, is alleged to be unsuitable for its
intended purpose or is alleged to be otherwise defective. For
example, we have been named as a defendant in numerous lawsuits as a result of
our detailing of Baycolâ on behalf of Bayer
Corporation (Bayer). Product liability claims, regardless of their
merits, could be costly and divert management's attention, or adversely affect
our reputation and the demand for our services or products. While we
rely on contractual indemnification provisions with our customers to protect us
against certain product liability related claims, we cannot assure you that
these provisions will be fully enforceable or that they will provide adequate
protection against claims intended to be covered. We currently have
product liability insurance in the aggregate amount of $5.0 million but cannot
assure you that our insurance will be sufficient to cover fully all potential
claims. Also, adequate insurance coverage might not be available in
the future at acceptable costs, if at all.
Our
business may suffer if we are unable to hire and retain key management personnel
to fill critical vacancies.
The
success of our business also depends on our ability to attract and retain
qualified senior management and experienced financial executives who are in high
demand and who often have competitive employment options. Currently, we have a
significant vacancy in our executive management. Steven K. Budd, the
former president of our sales services segment, resigned effective April 6,
2007. Michael J. Marquard, our Chief Executive Officer, is currently
assuming these responsibilities as we engage in a process to identify Mr. Budd’s
successor. Our failure to attract and retain qualified individuals
could have a material adverse effect on our business, financial condition or
results of operations.
Our
business may suffer if we fail to attract and retain qualified sales
representatives.
The
success and growth of our business depends in large part on our ability to
attract and retain qualified pharmaceutical sales
representatives. During 2006 and 2007, we experienced an unusually
high turnover rate among our sales representatives due to the expiration and
early termination of a number of significant sales force
arrangements. There is intense competition for pharmaceutical sales
representatives from CSOs and pharmaceutical companies. On occasion, our
customers have hired the sales representatives that we trained to detail their
products. We cannot assure you that we will continue to attract and retain
qualified personnel. If we cannot attract and retain qualified sales
personnel, we will not be able to maintain or expand our sales services business
and our ability to perform under our existing sales force contracts will be
impaired.
Changes
in governmental regulation could negatively impact our business
operations.
The
pharmaceutical and life sciences industries are subject to a high degree of
governmental regulation. Significant changes in these regulations
affecting the services we provide, including pharmaceutical product promotional
and marketing research services, physician interaction programs and medical
educational services, could result in the imposition of additional restrictions
on these types of activities, impose additional costs on us in providing these
services to our customers or otherwise negatively impact our business
operations. For example, the Accreditation Council for Continuing
Medical Education (ACCME) has several new policies, including a revision to
ACCME’s definition of “commercial interests”, which may restrict the medical
education services provided by our VIM business unit and/or could require us to
incur additional time and expense in order to comply with these policies upon
becoming effective.
Our
failure, or that of our customers, to comply with applicable healthcare
regulations could limit, prohibit or otherwise adversely impact our business
activities.
Various
laws, regulations and guidelines established by government, industry and
professional bodies affect, among other matters, the provision of, licensing,
labeling, marketing, promotion, sale and distribution of healthcare services and
products, including pharmaceutical products. In particular, the healthcare
industry is governed by various federal and state laws pertaining to healthcare
fraud and abuse, including prohibitions on the payment or
13
PDI,
Inc.
Annual
Report on Form 10-K (continued)
acceptance
of kickbacks or other remuneration in return for the purchase or lease of
products that are paid for by Medicare or Medicaid. Sanctions for violating
these laws include civil and criminal fines and penalties and possible exclusion
from Medicare, Medicaid and other federal or state healthcare programs. Although
we believe our current business arrangements do not violate these federal and
state fraud and abuse laws, we cannot assure you that our business practices
will not be challenged under these laws in the future or that a challenge would
not have a material adverse effect on our business, financial condition or
results of operations. Our failure, or the failure of our customers, to comply
with these laws, regulations and guidelines, or any change in these laws,
regulations and guidelines may, among other things, limit or prohibit our or our
customers’ current or business activities, subject us or our customers to
adverse publicity, increase the cost of regulatory compliance and insurance
coverage or subject us or our customers to monetary fines or other sanctions or
penalties.
If
our insurance and self-insurance reserves are insufficient to cover our future
liabilities for workers compensation, automobile and general liability and
employee health care benefits, our financial condition and results of operations
could be materially and adversely affected.
We use a
combination of insurance and self-insurance to provide for potential liabilities
for workers’ compensation, automobile and general liability and employee health
care benefits. Although we have reserved for these liabilities not
covered by insurance, our reserves are only an estimate based on actuarial data,
as well as on historical trends, and any projection of these losses is subject
to a high degree of variability and we may not be able to accurately predict the
number or value of the claims that occur in the future. In the event
that our actual liability exceeds our reserves for any given period, or if we
are unable to control rapidly increasing health care costs, our business,
financial condition and results of operations could be materially and adversely
affected.
If
our information technology and communications systems fail or we experience a
significant interruption in their operation, our reputation, business and
results of operations could be materially and adversely affected.
The
efficient operation of our business is dependent on our information technology
and communications systems. The failure of these systems to operate
as anticipated could disrupt our business and result in decreased revenue and
increased overhead costs. In addition, we do not have complete
redundancy for all of our systems and our disaster recovery planning cannot
account for all eventualities. Our information technology and
communications systems, including the information technology systems and
services that are maintained by third party vendors, are vulnerable to damage or
interruption from natural disasters, fire, terrorist attacks, malicious attacks
by computer viruses or hackers, power loss or failure of computer systems,
Internet, telecommunications or data networks. If these systems or
services become unavailable or suffer a security breach, we may expend
significant resources to address these problems, and our reputation, business
and results of operations could be materially and adversely
affected.
Our
stock price is volatile and could be further affected by events not within our
control, and an investment in our common stock could suffer a decline in
value.
The
market for our common stock is volatile. During 2007, our stock
traded at a low of $8.56 and a high of $12.40. In 2006, our stock
traded at a low of $9.37 and a high of $15.69, and in
2005, our stock traded at a low of $11.12 and a high of $22.26. The
trading price of our common stock has been and will continue to be subject
to:
|
|
·
|
volatility
in the trading markets generally;
|
|
|
·
|
significant
fluctuations in our quarterly operating
results;
|
|
|
·
|
significant
changes in our cash and cash equivalent
reserves;
|
|
|
·
|
announcements
regarding our business or the business of our
competitors;
|
|
|
·
|
strategic
actions by us or our competitors, such as acquisitions or
restructurings;
|
|
|
·
|
industry
and/or regulatory
developments;
|
|
|
·
|
changes
in revenue mix;
|
|
|
·
|
changes
in revenue and revenue growth rates for us and for our industry as a
whole;
|
|
|
·
|
changes
in accounting standards, policies, guidance, interpretations or
principles; and
|
|
|
·
|
statements
or changes in opinions, ratings or earnings estimates made by brokerage
firms or industry analysts relating to the markets in which we operate or
expect to operate.
|
Our
quarterly revenues and operating results may vary, which may cause the price of
our common stock to fluctuate.
Our
quarterly operating results may vary as a result of a number of factors,
including:
|
·
|
the
commencement, delay, cancellation or completion of sales and marketing
programs;
|
14
PDI,
Inc.
Annual
Report on Form 10-K (continued)
|
·
|
regulatory
developments;
|
|
|
·
|
uncertainty
about when, if at all, revenue from any product commercialization
arrangements and/or other incentive-based arrangements with our customers
will be recognized;
|
|
|
·
|
mix
of services provided and/or mix of programs during the
period;
|
|
|
·
|
timing
and amount of expenses for implementing new programs and accuracy of
estimates of resources required for ongoing
programs;
|
|
|
·
|
timing
and integration of any
acquisitions;
|
|
|
·
|
changes
in regulations related to pharmaceutical companies;
and
|
|
·
|
general
economic conditions.
|
In
addition, in the case of revenue related to service contracts, we recognize
revenue as services are performed, while program costs, other than training
costs, are expensed as incurred. For all contracts, training costs
are deferred and amortized on a straight-line basis over the shorter of the life
of the contract to which they relate or 12 months. As a result,
during the first two to three months of a new contract, we may incur substantial
expenses associated with implementing that new program without recognizing any
revenue under that contract. In addition, if we pursue product commercialization
opportunities as contemplated by our strategic plan, we will incur similar
implementation expenses and likely will not be able to recognize revenue from
the contract, if any, for an even greater period of time after commencement of
these types of programs. This could have a material adverse impact on
our operating results and the price of our common stock for the quarters in
which these expenses are incurred. For these and other reasons, we
believe that quarterly comparisons of our financial results are not necessarily
meaningful and should not be relied upon as an indication of future performance.
Fluctuations in quarterly results could materially and adversely affect the
market price of our common stock in a manner unrelated to our long-term
operating performance.
Our
controlling stockholder continues to have effective control of us, which could
delay or prevent a change in corporate control that may otherwise be beneficial
to our stockholders.
John P.
Dugan, our chairman, beneficially owns approximately 35% of our outstanding
common stock. As a result, Mr. Dugan is able to exercise substantial
control over the election of all of our directors and to determine the outcome
of most corporate actions requiring stockholder approval, including a merger
with or into another company, the sale of all or substantially all of our assets
and amendments to our certificate of incorporation. This ownership
concentration will limit our stockholders ability to influence corporate matters
and, as a result, we may take actions that other stockholders do not view as
beneficial, which may adversely affect the market price of our common
stock.
We
have anti-takeover defenses that could delay or prevent an acquisition and could
adversely affect the price of our common stock.
Our
certificate of incorporation and bylaws include provisions, such as providing
for three classes of directors, which may make it more difficult to remove our
directors and management and may adversely affect the price of our common stock.
In addition, our certificate of incorporation authorizes the issuance of "blank
check" preferred stock. This provision could have the effect of
delaying, deterring or preventing a future takeover or a change in control,
unless the takeover or change in control is approved by our board of
directors. We are also subject to laws that may have a similar
effect. For example, section 203 of the General Corporation Law of the State of
Delaware prohibits us from engaging in a business combination with an interested
stockholder for a period of three years from the date the person became an
interested stockholder unless certain conditions are met. As a result
of the foregoing, it will be difficult for another company to acquire us and,
therefore, could limit the price that possible investors might be willing to pay
in the future for shares of our common stock. In addition, the rights of our
common stockholders will be subject to, and may be adversely affected by, the
rights of holders of any class or series of preferred stock that may be issued
in the future.
|
ITEM
1B.
|
UNRESOLVED
STAFF COMMENTS
|
None.
|
ITEM
2.
|
PROPERTIES
|
Our
corporate headquarters are located in Saddle River, New Jersey where we lease
approximately 84,000 square feet. The lease runs for a term of
approximately 12 years, which began in July 2004. We entered into a
sublease for approximately 16,000 square feet of space in our Saddle River
facility for a term of five years which began in July 2005. The
sublease allows the subtenant to renew for an additional term of two
years. In July 2007, we entered into an additional sublease for
approximately 20,000 square feet of space in our Saddle River facility
for
15
PDI,
Inc.
Annual
Report on Form 10-K (continued)
the
remaining term of our lease, approximately eight and one-half
years. TVG operates out of a 37,000 square foot facility in Dresher,
Pennsylvania under a lease that runs for a term of approximately twelve years;
which began in January 2005. TVG entered into two subleases in 2007,
beginning in August and October, each for terms of five years, and are
approximately 3,000 and 4,700 square feet, respectively. Pharmakon
operates out of a 6,700 square foot facility in Schaumburg, Illinois, under a
lease that expires in February 2010. We believe that our current
facilities are adequate for our current and foreseeable operations and that
suitable additional space will be available if needed.
In 2007,
we had approximately $1.0 million of net charges related to unused office space
capacity and asset impairments related to the vacated space. In 2006,
we had net charges of approximately $657,000 related to unused office space
capacity at our Saddle River, New Jersey and Dresher, Pennsylvania locations and
$1.3 million in asset impairment charges for leasehold improvements and
furniture and fixtures associated with the unused office space at those
facilities. In the fourth quarter of 2005, we recorded charges of
approximately $2.4 million related to unused office space capacity at our Saddle
River and Dresher locations. There is approximately 4,100 square feet
of unused office space at Dresher that we are seeking to sublease in
2008.
|
ITEM
3.
|
LEGAL
PROCEEDINGS
|
Bayer-Baycol
Litigation
We have
been named as a defendant in numerous lawsuits, including two class action
matters, alleging claims arising from the use of Baycol, a prescription
cholesterol-lowering medication. Baycol was distributed, promoted and
sold by Bayer in the United States until early August 2001, at which time Bayer
voluntarily withdrew Baycol from the U.S. market. Bayer had retained
certain companies, such as us, to provide detailing services on its behalf
pursuant to contract sales force agreements. We may be named in
additional similar lawsuits. To date, we have defended these actions
vigorously and have asserted a contractual right of defense and indemnification
against Bayer for all costs and expenses we incur relating to these
proceedings. In February 2003, we entered into a joint defense and
indemnification agreement with Bayer, pursuant to which Bayer has agreed to
assume substantially all of our defense costs in pending and prospective
proceedings and to indemnify us in these lawsuits, subject to certain limited
exceptions. Further, Bayer agreed to reimburse us for all reasonable
costs and expenses incurred through such date in defending these
proceedings. As of December 31, 2007, Bayer has reimbursed us for
approximately $1.6 million in legal expenses, the majority of which was received
in 2003 and was reflected as a credit within selling, general and administrative
expense. We did not incur any costs or expenses relating to these
matters during 2005, 2006 or 2007.
California
Class Action Litigation
On
September 26, 2005, we were served with a complaint in a purported class action
lawsuit that was commenced against us in the Superior Court of the State of
California for the County of San Francisco on behalf of certain of our current
and former employees, alleging violations of certain sections of the California
Labor Code. During the quarter ended September 30, 2005, we accrued
approximately $3.3 million for potential penalties and other settlement costs
relating to both asserted and unasserted claims relating to this
matter. In October 2005, we filed an answer generally denying the
allegations set forth in the complaint. In December 2005, we reached
a tentative settlement of this action, subject to court approval. In
October 2006, we received preliminary settlement approval from the court and the
final approval hearing was held in January 2007. Pursuant to the settlement, we
have made all payments to the class members, their counsel and the California
Labor and Workforce Development Agency in an aggregate amount of approximately
$50,000, and the lawsuit was dismissed with prejudice in May
2007.
|
Other
Legal Proceedings
|
We are
currently a party to other legal proceedings incidental to our
business. As required, we have accrued our estimate of the probable
costs for the resolution of these claims. While management currently believes
that the ultimate outcome of these proceedings, individually and in the
aggregate, will not have a material adverse effect on our business, financial
condition or results of operations, litigation is subject to inherent
uncertainties. Were we to settle a proceeding for a material amount
or were an unfavorable ruling to occur, there exists the possibility of a
material adverse impact on our business, financial condition or results of
operations. Legal fees are expensed as
incurred.
|
|
ITEM
4.
|
SUBMISSION
OF MATTERS TO A VOTE OF SECURITY
HOLDERS
|
None.
16
PDI,
Inc.
Annual
Report on Form 10-K (continued)
PART
II
|
ITEM
5.
|
MARKET
FOR OUR COMMON EQUITY, RELATED STOCKHOLDER MATTERS
|
| AND ISSUER PURCHASES OF EQUITY SECURITIES |
|
Market
Information
|
Our
common stock is traded on the Nasdaq Global Market under the symbol
“PDII.” The price range per share of common stock presented below
represents the highest and lowest sales price for our common stock on the Nasdaq
Global Market for the last two years by quarter:
|
2007
|
2006
|
|||||||||||||||
|
HIGH
|
LOW
|
HIGH
|
LOW
|
|||||||||||||
|
First
quarter
|
$ | 10.98 | $ | 9.21 | $ | 15.11 | $ | 9.37 | ||||||||
|
Second
quarter
|
$ | 11.28 | $ | 9.00 | $ | 14.98 | $ | 9.87 | ||||||||
|
Third
quarter
|
$ | 12.40 | $ | 9.09 | $ | 15.69 | $ | 10.15 | ||||||||
|
Fourth
quarter
|
$ | 10.68 | $ | 8.56 | $ | 11.97 | $ | 9.50 | ||||||||
|
Holders
|
We had
327 stockholders of record as of February 29, 2008. Not reflected in
the number of record holders are persons who beneficially own shares of common
stock held in nominee or street name.
|
Dividends
|
We have
not declared any cash dividends and do not intend to declare or pay any cash
dividends in the foreseeable future. Future earnings, if any, will be
used to finance the future operation and growth of our business.
|
Securities
Authorized For Issuance Under Equity Compensation
Plans
|
We have
in effect a number of stock-based incentive and benefit programs designed to
attract and retain qualified directors, executives and management
personnel. All equity compensation plans have been approved by
security holders. The following table sets forth certain information
with respect to our equity compensation plans as of December 31,
2007:
|
Number
of securities
|
||||||
|
remaining
available for
|
||||||
|
Number
of securities to
|
Weighted-average
|
future
issuance
|
||||
|
be
issued upon exercise
|
exercise
price of
|
(excluding
securities
|
||||
|
Plan
Category
|
of
outstanding options (a)(1)
|
outstanding
options (b)
|
reflected
in column (a)) (1)
|
|||
|
Equity
compensation plans
|
||||||
|
approved
by security holders
|
||||||
|
(2004
Stock Award and
|
||||||
|
Incentive
Plan, 2000 Omnibus
|
||||||
|
Incentive
Compensation Plan,
|
||||||
|
and
1998 Stock Option Plan)
|
372,441
|
$ 23.37
|
1,519,043
|
|||
|
Equity
compensation plans not
|
||||||
|
approved
by security holders
|
-
|
-
|
-
|
|||
|
Total
|
372,441
|
$ 23.37
|
1,519,043
|
|||
|
(1) Excludes
restricted stock and stock-settled stock appreciation
rights.
|
||||||
|
Issuer
Purchases Of Equity Securities
|
From time
to time, we repurchase our common stock on the open market or in privately
negotiated transactions or both. On November 7, 2006 we announced
that our Board of Directors authorized us to repurchase up to one million shares
of our common stock, none of which have been repurchased. We did not
repurchase any shares of our common stock on the open market during
2007. Purchases, if any, will be made from available
cash.
Comparative
Stock Performance Graph
17
PDI,
Inc.
Annual
Report on Form 10-K (continued)
The graph
below compares the yearly percentage change in the cumulative total stockholder
return on our common stock, based on the market price of our common stock, with
the total return of companies included within the Nasdaq Composite Index for the
period commencing December 31, 2002 and ending December 31, 2007. The
calculation of total cumulative return assumes a $100 investment in our common
stock and the Nasdaq Composite Index on December 31, 2002, and the reinvestment
of all dividends.
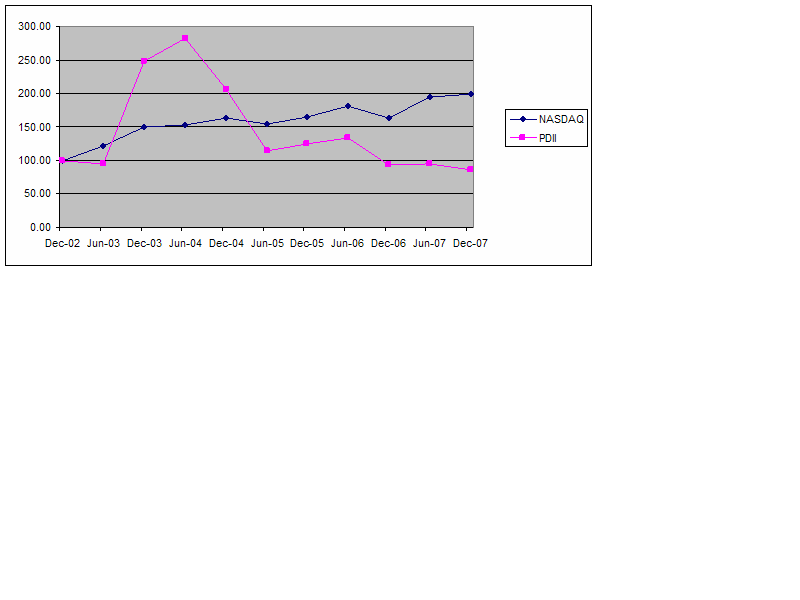
18
PDI,
Inc.
Annual
Report on Form 10-K (continued)
|
ITEM
6.
|
SELECTED
FINANCIAL DATA
|
The
selected financial data set forth below should be read in conjunction with
"Management's Discussion and Analysis of Financial Condition and Results of
Operations" and our consolidated financial statements and related notes
appearing elsewhere in this Form 10-K. The operations data for the
years ended December 31, 2007, 2006, and 2005 and the balance sheet data at
December 31, 2007 and 2006 are derived from our audited consolidated financial
statements appearing elsewhere in this Form 10-K. The operations data
for the years ended December 31, 2004 and 2003 and the balance sheet data at
December 31, 2005, 2004 and 2003 are derived from our audited consolidated
financial statements that are not included in this Form 10-K. The
historical results are not necessarily indicative of the results to be expected
in any future period. No cash dividends have been declared for any
period.
|
2007
|
2006
|
2005
|
2004
|
2003
|
||||||
|
Continuing operations data:
|
||||||||||
|
Total
revenues, net
|
$
117,131
|
$
239,242
|
$
305,205
|
$
345,797
|
(5)
|
$
330,547
|
||||
|
Gross
profit
|
31,615
|
55,844
|
52,402
|
92,633
|
84,960
|
|||||
|
Operating
expenses
|
45,853
|
(1)
|
49,931
|
(2)
|
65,064
|
(3)
|
58,554
|
65,897
|
||
|
Asset
impairment
|
42
|
-
|
6,178
|
(4)
|
-
|
-
|
||||
|
Total
operating expenses
|
45,895
|
49,931
|
71,242
|
58,554
|
65,897
|
|||||
|
(Loss)
income from
|
||||||||||
|
continuing
operations
|
$ (9,974)
|
$ 11,375
|
$
(11,407)
|
$ 20,435
|
$ 11,931
|
|||||
|
Per share data from continuing
operations:
|
||||||||||
|
(Loss)
income per share of common stock
|
||||||||||
|
Basic
|
$ (0.72)
|
$ 0.82
|
$ (0.80)
|
$ 1.40
|
$ 0.84
|
|||||
|
Diluted
|
$ (0.72)
|
$ 0.81
|
$ (0.80)
|
$ 1.37
|
$ 0.83
|
|||||
|
Weighted average number of shares
outstanding:
|
||||||||||
|
Basic
|
13,940
|
13,859
|
14,232
|
14,564
|
14,231
|
|||||
|
Diluted
|
13,940
|
13,994
|
14,232
|
14,893
|
14,431
|
|||||
|
Balance sheet data:
|
||||||||||
|
Cash
and short-term investments
|
$
106,985
|
$
114,684
|
$ 97,634
|
$
109,498
|
$
114,632
|
|||||
|
Working
capital
|
111,587
|
112,186
|
92,264
|
96,156
|
100,009
|
|||||
|
Total
assets
|
179,554
|
201,636
|
200,159
|
224,705
|
219,623
|
|||||
|
Total
long-term debt
|
-
|
-
|
-
|
-
|
-
|
|||||
|
Stockholders'
equity
|
140,189
|
149,197
|
135,610
|
165,425
|
138,488
|
|||||
|
|
(1)
|
Includes
$1.0 million in charges for facilities realignment costs. See
Note 14 to the consolidated financial statements for more
details.
|
|
|
(2)
|
Includes
$4.0 million in credits to legal expense related to settlements in the
Cellegy litigation matter and the California class action lawsuit and $2.0
million in charges for facilities realignment costs. See Note 9
and Note 14 to the consolidated financial statements for more
details. As a result of adopting FAS 123R in 2006 there was an
additional $290,000 recognized in stock compensation
expense.
|
|
|
(3)
|
Includes
$5.7 million for executive severance costs and $2.4 million for facilities
realignment costs. See Notes 13 and 14 to the consolidated
financial statements for more
details.
|
|
|
(4)
|
Asset
impairment charges include a $3.3 million non-cash charge for the
impairment of the goodwill associated with the Select Access reporting
unit; and a $2.8 million non-cash charge for the impairment of the Siebel
sales force automation platform. See Note 1 to the consolidated
financial statements for more
details.
|
|
|
(5)
|
Includes
revenue of $4.9 million associated with the acquisition of Pharmakon on
August 31, 2004.
|
|
|
(6)
|
Includes
product revenue of negative $11.6 million in
2003.
|
19
PDI,
Inc.
Annual
Report on Form 10-K (continued)
|
ITEM
7.
|
MANAGEMENT'S
DISCUSSION AND ANALYSIS OF FINANCIAL CONDITION AND RESULTS OF
OPERATIONS
|
We make
forward-looking statements that involve risks, uncertainties and assumptions in
this Form 10-K. Actual results may differ materially from those anticipated by
these forward-looking statements as a result of various factors, including, but
not limited to, those presented under the captions “Forward-Looking Statement
Information” and “Risk Factors” contained elsewhere in this Form
10-K.
The
following Management’s Discussion and Analysis of Financial Condition and
Results of Operations should be read in conjunction with our consolidated
financial statements and the related notes appearing elsewhere in this Form
10-K.
|
OVERVIEW
|
We are a
leading provider of contract sales teams to pharmaceutical companies, offering a
range of sales support services designed to achieve their strategic and
financial product objectives. In addition to contract sales teams, we also
provide marketing research, physician interaction and medical education
programs. Our services offer customers a range of promotional and
educational options
for the commercialization of their products throughout their lifecycles, from
development through maturity. We provide innovative and flexible service
offerings designed to drive our customers’ businesses forward and successfully
respond to a continually changing market. Our services provide a
vital link between our customers and the medical community through the
communication of product information to physicians and other healthcare
professionals for use in the care of their patients.
|
DESCRIPTION
OF REPORTING SEGMENTS AND NATURE OF
CONTRACTS
|
At
December 31, 2007, our reporting segments were as follows:
|
|
¨
|
Sales
Services:
|
|
|
·
|
Performance
Sales Teams; and
|
|
|
·
|
Select
Access.
|
|
|
¨
|
Marketing
Services:
|
|
|
·
|
Pharmakon;
|
|
|
·
|
TVG
Marketing Research and Consulting (TVG);
and
|
|
|
·
|
Vital
Issues in Medicine (VIM)®.
|
|
|
¨
|
PDI
Products Group (PPG).
|
In the
fourth quarter of 2005, we announced that we would be discontinuing our medical
devices and diagnostics (MD&D) business unit. Beginning in the
second quarter of 2006, the MD&D business unit was reported as discontinued
operations. An analysis of these reporting segments and their results
of operations are contained in Note 18 to our consolidated financial statements
and in the Consolidated
Results of Operations discussion below.
Nature
of Contracts by Segment
Our
contracts are nearly all fee for service. They may contain
operational benchmarks, such as a minimum amount of activity within a specified
amount of time. These contracts may include incentive payments that
can be earned if our activities generate results that meet or exceed performance
targets. Contracts may be terminated with or without cause by our
customers. Certain contracts provide that we may incur specific
penalties if we fail to meet stated performance
benchmarks. Occasionally, our contracts may require us to meet
certain financial covenants, such as maintaining a specified minimum amount of
working capital.
Sales
Services
During
fiscal 2007, approximately half of our revenue was generated by contracts for
Performance Sales teams. These contracts are generally for a term of
one to two years and may be renewed or extended. The majority of
these contracts, however, are terminable by the customer for any reason upon 30
to 90 days’ notice. Certain contracts provide for termination
payments if the customer terminates the contract without
cause. Typically, however, these penalties do not offset the revenue
we could have earned under the contract or the costs we may incur as a result of
its termination. The loss or termination of a large contract or the
loss of multiple contracts could have a material adverse effect on our business,
financial condition or results of operations.
20
PDI,
Inc.
Annual
Report on Form 10-K (continued)
Marketing
Services
Our
marketing services contracts generally take the form of either master service
agreements with a term of one to three years or contracts specifically related
to particular projects with terms typically lasting from two to six
months. These contracts are generally terminable by the customer for
any reason. Upon termination, the customer is generally responsible
for payment for all work completed to date, plus the cost of any nonrefundable
commitments made on behalf of the customer. There is significant
customer concentration in our Pharmakon business, and the loss or termination of
one or more of Pharmakon’s large master service agreements could have a material
adverse effect on our business, financial condition or results of
operations. Due to the typical size of most of TVG’s and VIM’s
contracts, it is unlikely the loss or termination of any individual TVG or VIM
contract would have a material adverse effect on our business, financial
condition or results of operations.
PPG
The
contracts within the products group were either performance based or fee for
service and may have required sales, marketing and distribution of a product. In
performance based contracts, we typically provided and financed a portion, if
not all, of the commercial activities in support of a brand in return for a
percentage of product sales. An important performance parameter was normally the
level of sales or prescriptions attained by the product during the period of our
marketing or promotional responsibility, and in some cases, for periods after
our promotional activities have ended.
|
CRITICAL
ACCOUNTING POLICIES
|
We
prepare our financial statements in accordance with U.S. generally accepted
accounting principles (GAAP). The preparation of financial statements
and related disclosures in conformity with GAAP requires our management to make
judgments, estimates and assumptions at a specific point in time that affect the
amounts reported in the consolidated financial statements and disclosed in the
accompanying notes. These assumptions and estimates are inherently
uncertain. Outlined below are accounting policies, which are important to
our financial position and results of operations, and require the most
significant judgments on the part of our management in their application.
Some of those judgments can be subjective and complex. Management’s
estimates are based on historical experience, information from third-party
professionals, facts and circumstances available at the time and various other
assumptions that are believed to be reasonable. Actual results could
differ from those estimates. Additionally, changes in estimates could
have a material impact on our consolidated results of operations in any one
period. For a summary of all of our significant accounting policies,
including the accounting policies discussed below, see Note 1 to our
consolidated financial statements.
Revenue
Recognition and Associated Costs
Revenue
and associated costs under pharmaceutical detailing contracts are generally
based on the number of physician details made or the number of sales
representatives utilized. With respect to risk-based contracts, all
or a portion of revenues earned are based on contractually defined percentages
of either product revenues or the market value of prescriptions written and
filled in a given period. These contracts are generally for terms of
one to two years and may be renewed or extended. The majority of
these contracts, however, are terminable by the customer for any reason upon 30
to 90 days’ notice. Certain contracts provide for termination
payments if the customer terminates us without cause. Typically,
however, these penalties do not offset the revenue we could have earned under
the contract or the costs we may incur as a result of its
termination. The loss or termination of a large pharmaceutical
detailing contract or the loss of multiple contracts could have a material
adverse effect on our business, financial condition or results of
operations.
Revenue
and associated costs under marketing service contracts are generally based on a
single deliverable such as a promotional program, accredited continuing medical
education seminar or marketing research/advisory program. The
contracts are generally terminable by the customer for any
reason. Upon termination, the customer is generally responsible for
payment for all work completed to date, plus the cost of any nonrefundable
commitments made on behalf of the customer. There is significant
customer concentration in our Pharmakon business, and the loss or termination of
one or more of Pharmakon’s large master service agreements would have a material
adverse on our business, financial condition or results of
operations. Due to the typical size of most contracts of TVG and VIM,
it is unlikely the loss or termination of any individual TVG or VIM contract
would have a material adverse effect on our business, financial condition or
results of operations.
21
PDI,
Inc.
Annual
Report on Form 10-K (continued)
Revenue
is recognized on product detailing programs and certain marketing, promotional
and medical education contracts as services are performed and the right to
receive payment for the services is assured. Many of the product detailing
contracts allow for additional periodic incentive fees to be earned if certain
performance benchmarks have been attained. Revenue earned from incentive fees
are recognized in the period earned and when we are reasonably assured that
payment will be made. Under performance based contracts, revenue is
recognized when the performance based parameters are achieved. Many
contracts also stipulate penalties if agreed upon performance benchmarks have
not been met. Revenue is recognized net of any potential penalties
until the performance criteria relating to the penalties have been
achieved. Commissions based revenue is recognized when performance is
completed less an allowance for estimated cancellations based on contractual
commitments and experience.
Revenue
and associated costs from marketing research contracts are recognized upon
completion of the contract. These contracts are generally short-term
in nature, typically lasting two to six months.
Cost of
services consists primarily of the costs associated with executing product
detailing programs, performance based contracts or other sales and marketing
services identified in the contract. Cost of services includes personnel costs
and other costs associated with executing a product detailing or other marketing
or promotional program, as well as the initial direct costs associated with
staffing a product detailing program. Such costs include, but are not limited
to, facility rental fees, honoraria and travel expenses, sample expenses and
other promotional expenses.
Personnel
costs, which constitute the largest portion of cost of services, include all
labor related costs, such as salaries, bonuses, fringe benefits and payroll
taxes for the sales representatives and sales managers and professional staff
that are directly responsible for executing a particular program. Initial direct
program costs are those costs associated with initiating a product detailing
program, such as recruiting, hiring, and training the sales representatives who
staff a particular product detailing program. All personnel costs and initial
direct program costs, other than training costs, are expensed as incurred for
service offerings.
Reimbursable
out-of-pocket expenses include those relating to travel and other similar costs,
for which we are reimbursed at cost by our customers. In
accordance with the requirements of Emerging Issues Task Force No. 01-14, “Income Statement Characterization
of Reimbursements Received for Out-of-Pocket Expenses Incurred” (EITF
01-14), reimbursements received for out-of-pocket expenses incurred are
characterized as revenue and an identical amount is included as cost of services
in the consolidated statements of operations.
Training
costs include the costs of training the sales representatives and managers on a
particular product detailing program so that they are qualified to properly
perform the services specified in the related contract. For all contracts,
training costs are deferred and amortized on a straight-line basis over the
shorter of the life of the contract to which they relate or 12
months. When we receive a specific contract payment from a customer
upon commencement of a product detailing program expressly to compensate us for
recruiting, hiring and training services associated with staffing that program,
such payment is deferred and recognized as revenue in the same period that the
recruiting and hiring expenses are incurred and amortization of the deferred
training is expensed. When we do not receive a specific contract
payment for training, all revenue is deferred and recognized over the life of
the contract.
Allowance
for Doubtful Accounts
We maintain allowances
for doubtful accounts for estimated losses resulting from the inability of our
customers to make required payments. We review a customer’s credit history
before extending credit. We establish an allowance for doubtful
accounts based on the aging of a customer’s accounts receivable or when we
become aware of a customer’s inability to meet its financial obligations (e.g.,
a bankruptcy filing). We operate almost exclusively in the
pharmaceutical industry and to a great extent our revenue is dependent on a
limited number of large pharmaceutical companies. We also partner
with customers in the emerging pharmaceutical sector, some of whom may have
limited financial resources. A general downturn in the pharmaceutical
industry or a material adverse event to one or more of our emerging
pharmaceutical customers could result in higher than expected customer defaults
requiring additional allowances.
22
PDI,
Inc.
Annual
Report on Form 10-K (continued)
Goodwill,
Intangibles and Other Long-Lived Assets
We
allocate the cost of the acquired companies to the identifiable tangible and
intangible assets and liabilities acquired, with the remaining amount being
classified as goodwill. Since the entities we have acquired do not
have significant tangible assets, a significant portion of the purchase price
has been allocated to intangible assets and goodwill. The
identification and valuation of these intangible assets and the determination of
the estimated useful lives at the time of acquisition, as well as the completion
of annual impairment tests require significant management judgments and
estimates. These estimates are made based on, among other factors,
consultations with an accredited independent valuation consultant, reviews of
projected future operating results and business plans, economic projections,
anticipated future cash flows and the cost of capital. The use of
alternative estimates and assumptions could increase or decrease the estimated
fair value of goodwill and other intangible assets, and potentially result in a
different impact to the Company’s results of operations. Further,
changes in business strategy and/or market conditions may significantly impact
these judgments thereby impacting the fair value of these assets, which could
result in an impairment of the goodwill and acquired intangible
assets.
We have
elected to do the annual tests for indications of goodwill impairment as of
December 31 of
each year. We utilize a discounted cash flow model to determine fair value
in the goodwill impairment evaluation. In assessing the
recoverability of goodwill, projections regarding estimated future cash flows
and other factors are made to determine the fair value of the respective
reporting units.
We review
the recoverability of long-lived assets and finite-lived intangible assets
whenever events or changes in circumstances indicate that the carrying value of
such assets may not be recoverable. If the sum of the expected future
undiscounted cash flows is less than the carrying amount of the asset, an
impairment loss is recognized by reducing the recorded value of the asset to its
fair value measured by future discounted cash flows. This analysis
requires estimates of the amount and timing of projected cash flows and, where
applicable, judgments associated with, among other factors, the appropriate
discount rate. Such estimates are critical in determining whether any
impairment charge should be recorded and the amount of such charge if an
impairment loss is deemed to be necessary. In addition, future events
impacting cash flows for existing assets could render a write-down or write-off
necessary that previously required no such write-down or write-off.
While we
use available information to prepare our estimates and to perform impairment
evaluations, actual results could differ significantly from these estimates or
related projections, resulting in impairment and losses related to recorded
goodwill or long-lived asset balances.
|
Self-Insurance
Accruals
|
We are
self-insured for certain losses for claims filed and claims incurred but not
reported relating to workers’ compensation and automobile-related losses for our
company-leased cars. Our liability for these losses is estimated on
an actuarial undiscounted basis using individual case-based valuations and
statistical analysis supplied by our insurance brokers and insurers and is based
upon judgment and historical experience; however, the final cost of many of
these claims may not be known for five years or longer. In 2007, we
also were self-insured for certain benefits paid under our employee healthcare
programs. Our liability for medical claims is estimated using an
underwriting determination that is based on current year’s average number of
days between when a claim is incurred and when it is paid; however, the final
cost of medical claims incurred in 2007 may not be known until second quarter of
2008.
We
maintain stop-loss coverage with third-party insurers to limit our total
exposure on these programs. Periodically, we evaluate the level of
insurance coverage and adjust insurance levels based on risk tolerance and
premium expense. Management reviews these accruals on a quarterly
basis. At December 31, 2007 and 2006, self-insurance accruals totaled
$2.9 million and $2.5 million, respectively.
Contingencies
In the
normal course of business, we are subject to various contingencies.
Contingencies are recorded in the consolidated financial statements when
it is probable that a liability will be incurred and the amount of the loss can
be reasonably estimated, or otherwise disclosed, in accordance with SFAS No. 5,
“Accounting for
Contingencies” (SFAS 5). We are currently
involved in certain legal proceedings and, as required, we have accrued our
estimate of the probable costs for the resolution of these claims. These
estimates are developed in consultation with outside counsel and are based upon
an analysis of potential results, assuming a combination of litigation and
settlement strategies. Predicting the outcome of claims and litigation,
and estimating related costs and exposures, involves substantial uncertainties
that could cause actual costs to vary materially from
estimates.
23
PDI,
Inc.
Annual
Report on Form 10-K (continued)
Income
Taxes
We
account for income taxes using the asset and liability method. This
method requires recognition of deferred tax assets and liabilities for expected
future tax consequences of temporary differences that currently exist between
tax bases and financial reporting bases of our assets and liabilities based on
enacted tax laws and rates. A valuation allowance is established, when
necessary, to reduce the deferred income tax assets when it is more likely than
not that all or a portion of a deferred tax asset will not be
realized.
We
operate in multiple tax jurisdictions and provide taxes in each jurisdiction
where we conduct business and are subject to taxation. The breadth of our
operations and the complexity of the various tax laws require assessments of
uncertainties and judgments in estimating the ultimate taxes we will
pay. The final taxes paid are dependent upon many factors, including
negotiations with taxing authorities in various jurisdictions, outcomes of tax
litigation and resolution of proposed assessments arising from federal and state
audits. We have established estimated liabilities for federal and
state income tax exposures that arise and meet the criteria for accrual under
FIN 48. These
accruals represent accounting estimates that are subject to inherent
uncertainties associated with the tax audit process. We adjust these
accruals as facts and circumstances change, such as the progress of a tax audit.
We believe that any potential audit adjustments will not have a material adverse
effect on our financial condition or liquidity. However, any adjustments made
may be material to our consolidated results of operations for a reporting
period.
Significant
judgment is also required in evaluating the need for and magnitude of
appropriate valuation allowances against deferred tax assets. We
currently have significant deferred tax assets resulting from net operating loss
carryforwards and deductible temporary differences. The realization
of these assets is dependent on generating future taxable income. We
perform an analysis quarterly to determine whether the expected future income
will more likely than not be sufficient to realize the deferred tax
assets. Our recent operating results and projections of future income
weighed heavily in our overall assessment. The minimum amount of
future taxable income that would have to be generated to realize our net
deferred tax assets is approximately $30 million and the existing levels of
pretax earnings for financial reporting purposes are not sufficient to generate
this amount of future taxable income. As a result, we established a
full federal and state valuation allowance for the net deferred tax assets at
December 31, 2007 and 2006 because we determined that it was more likely than
not that these assets would not be realized. At December 31, 2007 and
2006, we had a valuation allowance of approximately $11.7 million and $6.8
million, respectively, related to our net deferred tax assets that cannot be
carried back.
|
Stock
Compensation Costs
|
The
estimated compensation cost associated with the granting of stock-based awards
is based on the grant date fair value of the stock award on the date of grant.
We recognize the compensation cost, net of estimated forfeitures, over the
vesting term. Forfeitures are initially estimated based on historical
information and subsequently updated over the life of the awards to ultimately
reflect actual forfeitures. As a result, changes in forfeiture activity
can influence the amount of stock compensation cost recognized from period to
period.
We use
the Black-Scholes option pricing model to determine the fair value of stock
options and stock-based stock appreciation rights (SARs). The determination of
the fair value of stock-based payment awards is made on the date of grant and is
affected by our stock price as well as assumptions made regarding a number of
complex and subjective variables. These assumptions including our
expected stock price volatility over the term of the awards, actual and
projected employee stock option exercise behaviors, the risk-free interest rate,
and expected dividend yield. Our assumptions are detailed in Note 11
to our consolidated financial statements.
Changes
in the valuation assumptions could result in a significant change to the cost of
an individual award. However, the total cost of an award is also a
function of the number of awards granted, and as result, we have the ability to
manage the cost and value of our equity awards by adjusting the number of awards
granted.
Restructuring,
Facilities Realignment and Related Costs
From time
to time, in order to consolidate operations, downsize and improve operating
efficiencies, we recognize restructuring or facilities realignment
charges. The recognition of these charges requires estimates and
judgments regarding employee termination benefits, lease termination costs and
other exit costs to be incurred when these actions take place. Actual
results can vary from these estimates, which results in adjustments in the
period of the change in estimate.
24
PDI,
Inc.
Annual
Report on Form 10-K (continued)
|
CONSOLIDATED
RESULTS OF OPERATIONS
|
The
following table sets forth for the periods indicated below selected statement of
continuing operations data as a percentage of revenue. The trends
illustrated in this table may not be indicative of future operating
results.
|
Years
Ended December 31,
|
||||||||||||||||||||
|
Continuing
operations data
|
2007
|
2006
|
2005
|
2004
|
2003
|
|||||||||||||||
|
Revenues:
|
||||||||||||||||||||
|
Service,
net
|
100.0 | % | 100.0 | % | 100.0 | % | 100.4 | % | 103.5 | % | ||||||||||
|
Product,
net
|
- | - | - | (0.4 | %) | (3.5 | %) | |||||||||||||
|
Total
revenues, net
|
100.0 | % | 100.0 | % | 100.0 | % | 100.0 | % | 100.0 | % | ||||||||||
|
Cost
of goods and services:
|
||||||||||||||||||||
|
Cost
of services
|
73.0 | % | 76.7 | % | 82.8 | % | 73.1 | % | 73.9 | % | ||||||||||
|
Cost
of goods sold
|
- | - | - | 0.1 | % | 0.4 | % | |||||||||||||
|
Total
cost of goods and services
|
73.0 | % | 76.7 | % | 82.8 | % | 73.2 | % | 74.3 | % | ||||||||||
|
Gross
profit
|
27.0 | % | 23.3 | % | 17.2 | % | 26.8 | % | 25.7 | % | ||||||||||
|
Operating
expenses:
|
||||||||||||||||||||
|
Compensation
expense
|
20.9 | % | 11.7 | % | 8.5 | % | 8.9 | % | 10.6 | % | ||||||||||
|
Other
selling, general and administrative
|
17.1 | % | 9.5 | % | 9.6 | % | 7.2 | % | 8.6 | % | ||||||||||
|
Asset
impairment
|
0.1 | % | - | 2.0 | % | - | - | |||||||||||||
|
Executive
severance
|
- | 0.2 | % | 1.9 | % | 0.1 | % | - | ||||||||||||
|
Legal
and related costs, net
|
0.3 | % | (1.4 | %) | 0.6 | % | 0.7 | % | 0.7 | % | ||||||||||
|
Facilities
realignment
|
0.9 | % | 0.8 | % | 0.8 | % | - | - | ||||||||||||
|
Total
operating expenses
|
39.2 | % | 20.9 | % | 23.3 | % | 16.9 | % | 19.9 | % | ||||||||||
|
Operating
(loss) income
|
(12.2 | %) | 2.5 | % | (6.2 | %) | 9.9 | % | 5.8 | % | ||||||||||
|
Gain
(loss) on investments
|
- | - | 1.5 | % | (0.3 | %) | - | |||||||||||||
|
Interest
income, net
|
5.2 | % | 2.0 | % | 1.0 | % | 0.5 | % | 0.3 | % | ||||||||||
|
(Loss)
income from continuing operations
|
||||||||||||||||||||
|
before
income taxes
|
(7.0 | %) | 4.5 | % | (3.7 | %) | 10.1 | % | 6.1 | % | ||||||||||
|
Income
tax expense (benefit)
|
1.5 | % | (0.3 | %) | 0.1 | % | 4.2 | % | 2.5 | % | ||||||||||
|
(Loss)
income from continuing operations
|
(8.5 | %) | 4.8 | % | (3.7 | %) | 5.9 | % | 3.6 | % | ||||||||||
|
Comparison
of 2007 and 2006
|
|
Revenue
(in thousands)
|
||||||||||||||||
|
Change
|
Change
|
|||||||||||||||
|
2007
|
2006
|
($)
|
(%)
|
|||||||||||||
|
Sales
services
|
$ | 86,766 | $ | 202,748 | $ | (115,982 | ) | (57.2 | %) | |||||||
|
Marketing
services
|
30,365 | 36,494 | (6,129 | ) | (16.8 | %) | ||||||||||
|
PPG
|
- | - | - | - | ||||||||||||
|
Total
|
$ | 117,131 | $ | 239,242 | $ | (122,111 | ) | (51.0 | %) | |||||||
The
decrease in total revenues of $122.1 or 51.0% was primarily related to the
termination of several large contracts in 2006.
25
PDI,
Inc.
Annual
Report on Form 10-K (continued)
Effective
April 30, 2006, AstraZeneca terminated its contract sales force arrangement with
us, which represented approximately $43.0 million in revenue in
2006. On September 26, 2006, we announced that GSK would not be
renewing its contract with us when it expired on December 31,
2006. This contract represented $67.4 million in revenue in
2006. On October 25, 2006, we announced that we had received
notification from sanofi-aventis of its intention to terminate its contract
sales engagement with us effective December 1, 2006. This contract
represented approximately $18.3 million in revenue in
2006. Additionally, on March 21, 2007, we announced that a large
pharmaceutical company customer had notified us of its intention not to renew
its contract sales engagement with us upon its scheduled expiration on May 12,
2007. This contract, which had a one-year term, provided for approximately $37
million in annual revenue and represented a $7.1 million decline in revenue when
compared to 2006. The loss in revenue from those terminated and expired
contracts was partially offset by new sales force arrangements we entered into
during 2007, including a contract sales force engagement for our Select Access
business unit in March 2007, which generated approximately $12.0 million in
revenue in 2007 and a dedicated contract sales force engagement entered into
during June 2007 which generated approximately $14.6 million in revenue in
2007.
The sales
services segment revenue decreased by $116.0 million compared to 2006 primarily
due to the contract terminations.
Revenue
for the marketing services segment decreased by $6.1 million or 16.8% which was
attributable to a $3.9 million decrease in TVG revenue, as well as decreases at
both Pharmakon and VIM due to fewer projects at all three business
units.
The PPG
segment did not have any revenue in either period.
|
Cost
of services (in thousands)
|
||||||||||||||||
|
Change
|
Change
|
|||||||||||||||
|
2007
|
2006
|
($)
|
(%)
|
|||||||||||||
|
Sales
services
|
$ | 68,554 | $ | 163,735 | $ | (95,181 | ) | (58.1 | %) | |||||||
|
Marketing
services
|
16,962 | 19,663 | (2,701 | ) | (13.7 | %) | ||||||||||
|
PPG
|
- | - | - | - | ||||||||||||
|
Total
|
$ | 85,516 | $ | 183,398 | $ | (97,882 | ) | (53.4 | %) | |||||||
The sales
services segment had a reduction of $95.2 million in cost of services, which is
primarily attributable to the contract terminations mentioned
above. Cost of services within the marketing services segment
decreased approximately $2.7 million, or 13.7% due to fewer projects at all
three business units. The PPG segment had no costs of services
expense in either 2007 or 2006.
|
Gross
profit (in thousands)
|
||||||||||||||||||||||||
|
%
of
|
%
of
|
Change
|
Change
|
|||||||||||||||||||||
|
2007
|
revenue
|
2006
|
revenue
|
($)
|
(%)
|
|||||||||||||||||||
|
Sales
services
|
$ | 18,212 | 21.0 | % | $ | 39,013 | 19.2 | % | $ | (20,801 | ) | (53.3 | %) | |||||||||||
|
Marketing
services
|
13,403 | 44.1 | % | 16,831 | 46.1 | % | (3,428 | ) | (20.4 | %) | ||||||||||||||
|
PPG
|
- | - | - | - | - | - | ||||||||||||||||||
|
Total
|
$ | 31,615 | 27.0 | % | $ | 55,844 | 23.3 | % | $ | (24,229 | ) | (43.4 | %) | |||||||||||
The two
primary reasons for the increase in gross profit percentage were: 1) the higher
margin businesses within marketing services were a greater portion of
consolidated revenue than they were in the prior period (25.9% in 2007 vs. 15.3%
in 2006); and 2) the gross profit percentage for Select Access increased from
15.2% in 2006 to 21.4% in 2007. This increase was primarily a result
of fixed service costs (i.e. sales force management) being a smaller percentage
of total revenue as Select Access revenue increased approximately 63.7% in
2007.
The
increase in gross profit percentage for the sales services segment can be
primarily attributed to Select Access. The decrease in total sales
services’ gross profit can be attributed to the contract terminations discussed
above. The segment benefited from recognizing $550,000 in revenue and
gross profit in 2007 associated with a contract with a former emerging
pharmaceutical client for services performed in 2006. Because of the
uncertainty surrounding collections, we recognized revenue from this client on a
cash basis. All costs associated with this
26
PDI,
Inc.
Annual
Report on Form 10-K (continued)
contract
were recognized in 2006. The segment also benefited from recognizing
$558,000 in revenue and gross profit in 2007 associated with accrued penalties
with a former sales force client. Because the likelihood of paying
these penalties was deemed remote, the accrual was reversed in the fourth
quarter of 2007 and recognized as revenue.
The
decrease in gross profit attributable to the marketing services segment was
commensurate with the decrease in revenue discussed above as total gross profit
decreased at all three business units. The gross profit percentage
decreased to 44.1% from 46.1% in the comparable prior year period.
The PPG
segment had no gross profit in 2007 or 2006.
(Note:
Compensation and other Selling, General and Administrative (other SG&A)
expense amounts for each segment contain allocated corporate
overhead.)
|
Compensation
expense (in thousands)
|
||||||||||||||||||||||||
|
%
of
|
%
of
|
Change
|
Change
|
|||||||||||||||||||||
|
2007
|
revenue
|
2006
|
revenue
|
($)
|
(%)
|
|||||||||||||||||||
|
Sales
services
|
$ | 15,973 | 18.4 | % | $ | 19,410 | 9.6 | % | $ | (3,437 | ) | (17.7 | %) | |||||||||||
|
Marketing
services
|
8,543 | 28.1 | % | 8,665 | 23.7 | % | (122 | ) | (1.4 | %) | ||||||||||||||
|
PPG
|
- | - | - | - | - | - | ||||||||||||||||||
|
Total
|
$ | 24,516 | 20.9 | % | $ | 28,075 | 11.7 | % | $ | (3,559 | ) | (12.7 | %) | |||||||||||
The
decrease in compensation expense for both sales services and marketing services
segments in 2007 was the result of reduced headcount and unfilled executive
positions when compared to 2006. As a percentage of total revenue,
compensation expense increased to 20.9% for 2007 from 11.7% in 2006 primarily
due to the decrease in revenue.
The PPG
segment did not have any compensation expense in 2007 or 2006.
|
Other
SG&A (in thousands)
|
||||||||||||||||||||||||
|
%
of
|
%
of
|
Change
|
Change
|
|||||||||||||||||||||
|
2007
|
revenue
|
2006
|
revenue
|
($)
|
(%)
|
|||||||||||||||||||
|
Sales
services
|
$ | 15,033 | 17.3 | % | $ | 18,109 | 8.9 | % | $ | (3,076 | ) | (17.0 | %) | |||||||||||
|
Marketing
services
|
4,948 | 16.3 | % | 4,501 | 12.3 | % | 447 | 9.9 | % | |||||||||||||||
|
PPG
|
- | - | - | - | - | - | ||||||||||||||||||
|
Total
|
$ | 19,981 | 17.1 | % | $ | 22,610 | 9.5 | % | $ | (2,629 | ) | (11.6 | %) | |||||||||||